
Standings are a Liar... Sometimes
When the GSB takes on a task concerning league statistics we generally try to take a deeper look than what the surface-level details can provide.
Any ape with a functioning internet connection can pull up the standings and identify who's winning and who's losing. But wins and losses only tell us what happened, not necessarily what should have happened.
Five weeks into the season, some owners have been rewarded for their brilliance. Others have been rewarded for the simple act of playing someone even worse. And a select few have apparently offended whatever higher power determines fantasy football matchups.
In this 'By the Numbers' article the GSB set out to determine who has actually earned their record, who has benefited from a favorable schedule, and who deserves financial compensation for the psychological damage they've endured.
The Fantasy Luck Index
Thanks to this handy-dandy website Matt has created for us, my grubby little nerd fingers have never-before-seen access to all matchup results throughout our League's history.
Using this data I was able to develop a metric I like to call the Fantasy Luck Index, or FLUCK for short - yes I really considered taking out the L.
FLUCK represents the difference between a team's actual wins and expected wins thus far this season.
Expected wins can be determined by a team's Global Win% against all teams in all weeks, and multiplying by how many weeks we have had.
For example, Naberhood Watch has a Global Win% of about 66.7% so their expected wins is calculated as:
(5 weeks) x 66.7% = 3.33
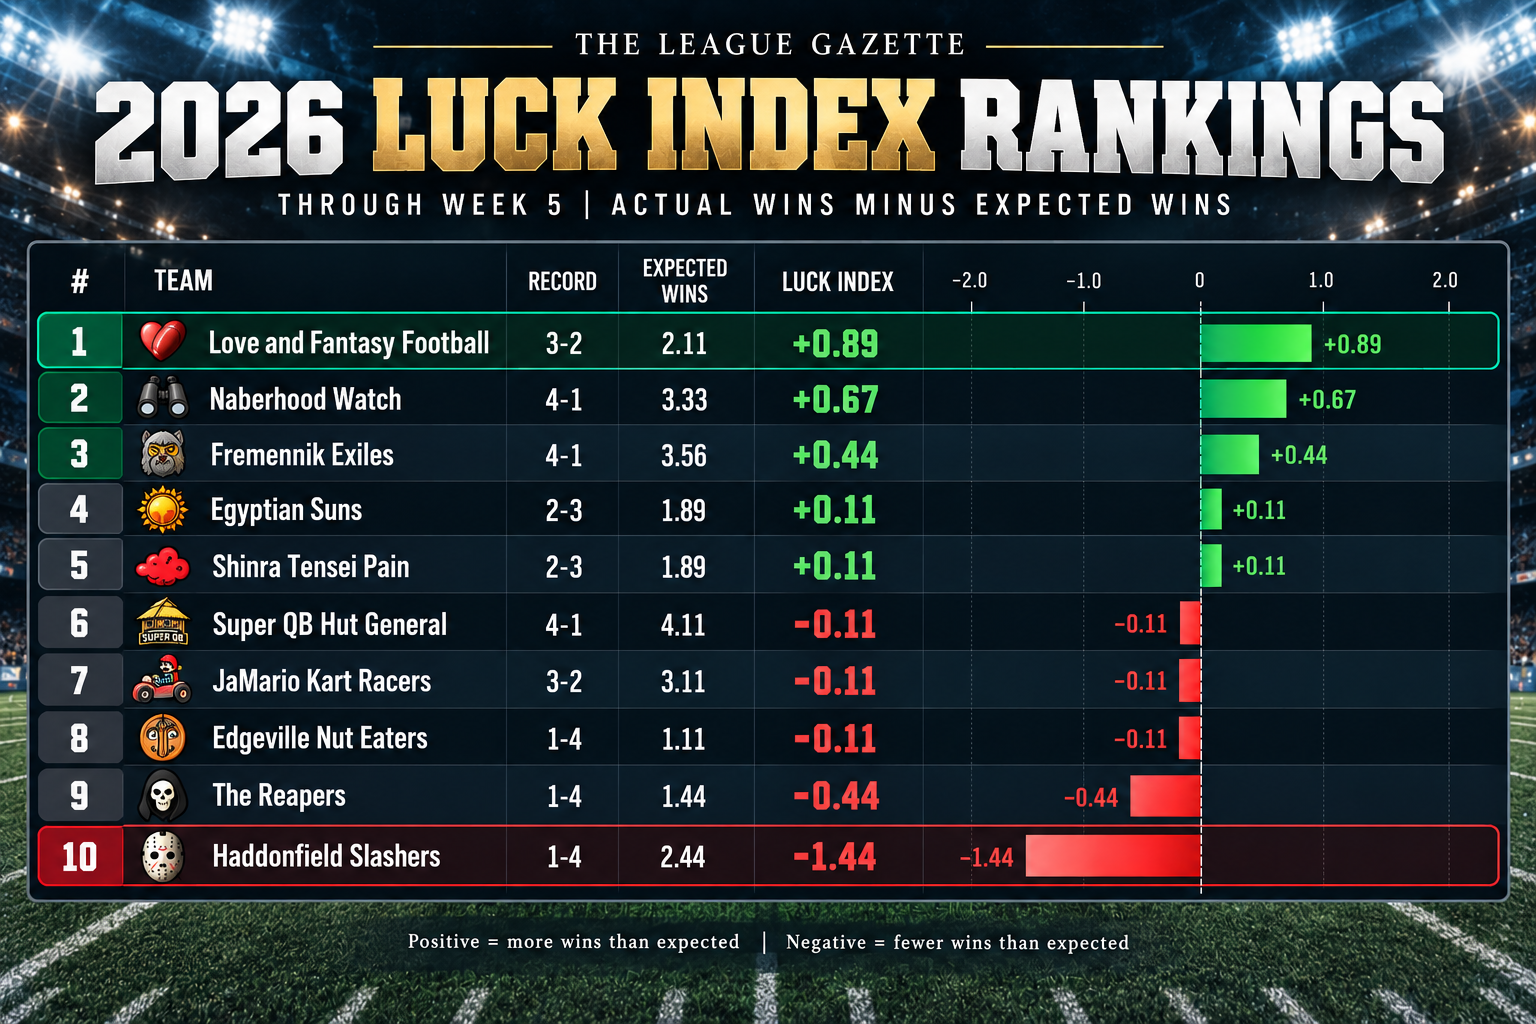
Using this method we have obtained the FLUCK values for all teams and ranked them accordingly:
Poor Haddonfield
As we have so eloquently highlighted in other Gazette articles this season, the Haddonfield Slashers have been bent over the proverbial barrel time after time to start the season.
The Slashers come in as statistically the unluckiest team in the league by a wide margin. Their expected wins is 2.44, nearly a game and a half, higher than their true win total of just a single game.
They find themselves all the way in rock bottom and a full game worse off than even our second unluckiest team - The Reapers.

The Slashers have had two losses in particular that have created the situation they're in now.
The first being a 9-point loss against the Racers in Week 2 despite dropping nearly 150 points, and the second being a loss to The General after scoring the second most points in the League.
Turns out, the Slasher's 1.44 games below expected is actually the second worst start to a season in league history.
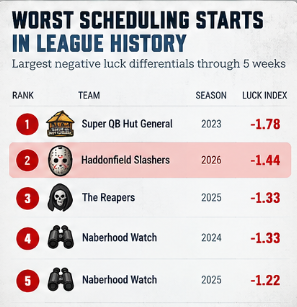
So not the worst... but kind of is still - isn't it?
Lady Luck's Lost Love

For every manager who finds themselves drawing the short straw, that just leaves the long straws left for everyone else.
The League's lucky little leprechaun through Week 5 is Love & Fantasy Football.
Maybe not as dramatically dislocated from their expected wins as the Slashers, Love & Fantasy Football does currently enjoy nearly a full extra win compared to expectations.
Like the Slashers though, their performance also is being driven by performances in just two weeks.
Week 3 saw them win a nail biter against Team Pain whilst only scoring 117 total points, one of the lowest in the league. This week alone produces most of the advantage.
Week 5 contributes as well, though, as even though they cruised to a comfortable win behind 145 points they actually ended up in the middle of the league in scoring that week.
Time to Take this Too Far

Okay, so we have identified that the standings are not always reliable in telling the full story of how good a fantasy team is.
But what kind of GSB analyst would I be if I didn't take this opportunity to go the extra mile and venture into taking this analysis way too far.
Using expected wins as the basis for luck was a really good start, but at the end of the day it might not hold up to true scrutiny from my analytical peers.
To combat this, I wanted to dig into my actuarial bag of tricks and bring the proverbial nuclear bomb to a knife fight - Monte Carlo Simulations.
That's right everyone, I took the results of each weekly matchup and simulated random matchups against other teams for 500,000 scenarios.
This allowed me to determine just how likely everyone's current record was given all possible scheduling scenarios. This is a much more powerful form of analysis that normally I only get to do at my day job, but busted out just for you all.
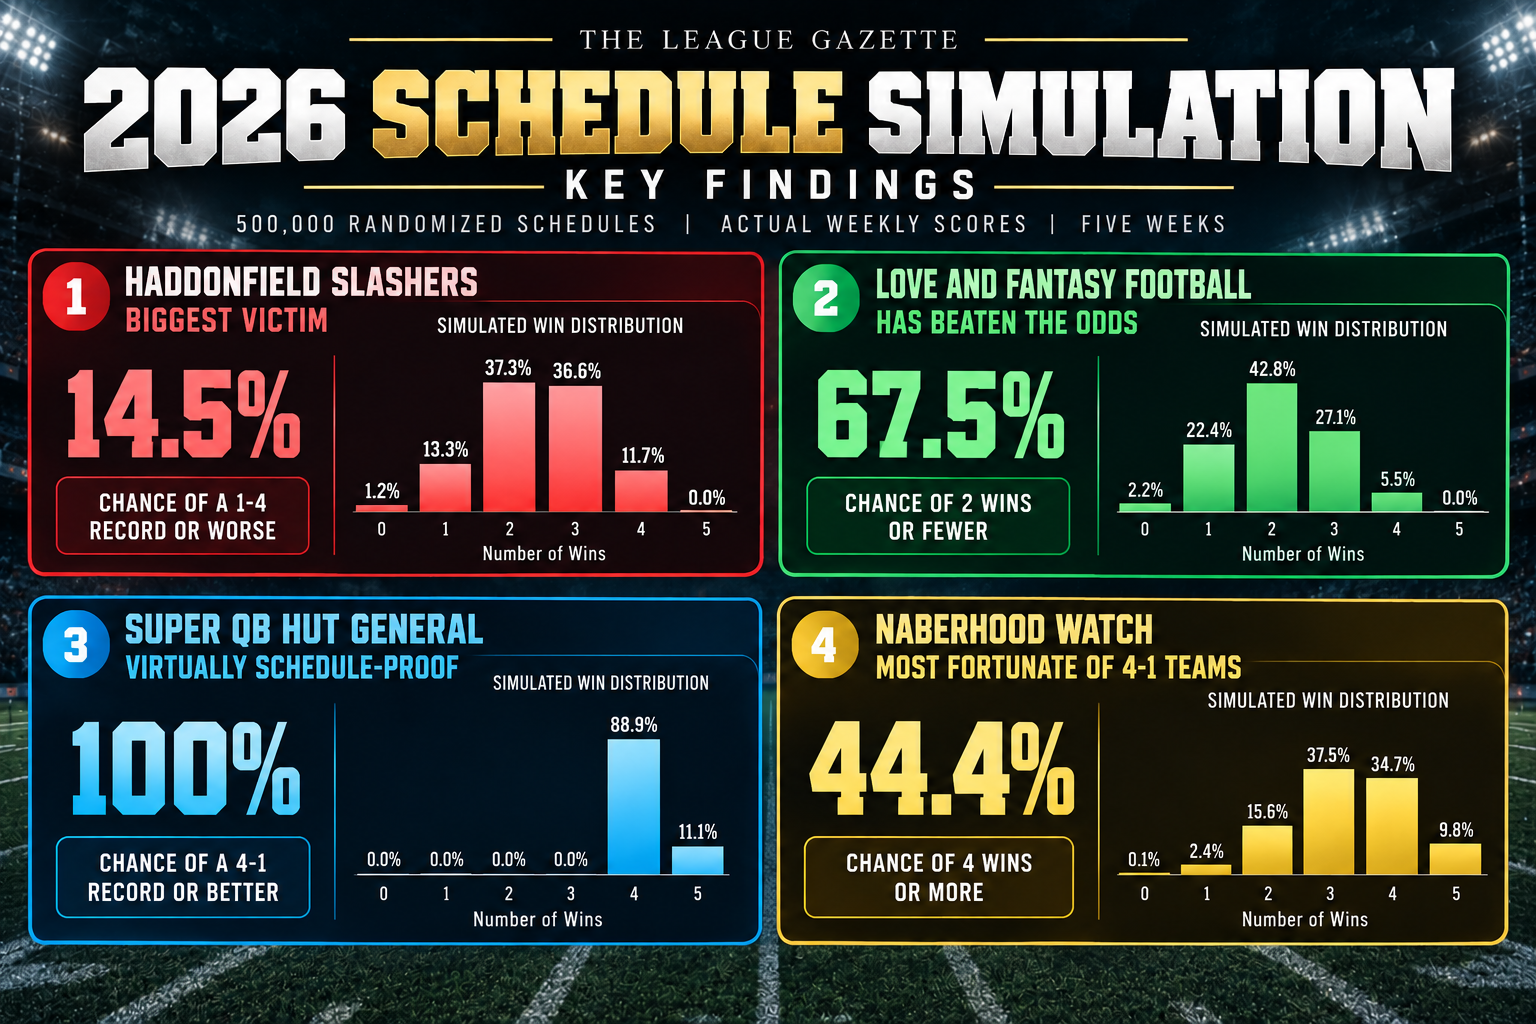
As can be seen, we didn't exactly reinvent the wheel in determining the League's most snake-bitten team in the Slashers. Although, I'm sure Matt will now have a restless night knowing there was a 1 in 8.5 chance he would be 4-1 right now.
The real interesting items here concern two of our top teams this season: Naberhood Watch and Super QB Hut General.
Turns out, she is... inevitable, and the General didn't have a single simulation where she wasn't at least 4-1. Turns out, having the top score in four weeks is really good.
Naberhood Watch on the other hand has really exceeded their simulated destiny achieving four wins despite over a quarter-million scenarios landing them at 3-2 or worse.
Alright AJ, Wrap it Up
For some, this analysis can give them solace in the fact that they are right where they're supposed to be. For others they can understand just how far from expectations they have landed.
Just know that there is a lot of season left to play, and the bill always comes due eventually.
You can sit back and hope that the Slashers will keep getting caught holding the bag, or you can make the moves now to ensure that the pendulum doesn't swing back in your direction.
Good luck everyone, and may the odds be ever in my favor.


Reader conversation
Join the conversation
Share your take on this story. Comments publish immediately, and you can edit your own comment whenever you need to.
Sign in to add your perspective.
No comments yet. Be the first to share a thought.