
The Why...

Since our draft finished just over half a fortnight ago, I have personally been tossing and turning in my sleep (and according to the dentist, grinding my teeth) trying to find a cope strong enough to overcome my own 10th pick position. This inner turmoil actually got me thinking - "How much does all this even matter?"
Each year we all cross our fingers before league commissioners everywhere gift the top draft spots to their siblings, wives, and very generous Patreon supporters. Of course we all roll our eyes and make off-color politically intensive jokes, but does your pick positioning actually make a difference between now and the end of the season?
Well, we at the Gazette Sports Bureau (GSB) decided to take a look at the past four years of data to answer this very question once and for all.
Is This the Cope I've Been Looking For?
I've always wanted to jump into this sort of analysis and we have finally reached a point in this young league's history that we have met the bare minimum criteria for statistical analysis - a sample size of 30 or more.
That's right y'all, get snapped back to Stats 101 and pretend with me that we can actually gain credible insight from a sample as deep as this (Shhh... Scott this is where you keep quiet my guy).
With this new lease on wasting perfectly good time, the first thing we at the GSB investigated was something called Spearman's P. Who is Spearman? Why do we care about his P? WRONG QUESTIONS.
The important thing here is that this is a correlation metric specifically designed for ranked data, and that is exactly what we need. Our goal is to determine if there is a significant relationship between draft position and regular season final ranking.
Spearman's P can have a value between -1.0 and 1.0, with values closer to either end showing stronger relationships. Basically, if we are far from zero then great, we proved there is something here.
So all we need to do is take our historical data, compare final ranks against starting draft position, plug it all into my man Spearman’s fancy little algorithm, and spit out a value of:
-0.1358...
Okay, okay, so the correlation is really small, and negative (we will get to that - trust), but maybe the almighty p-value will save the day! As long as we get something small (<50% likely? 40%?) then we can finally prove that there is some relatio...
89.3%... 89.3% likely that there is no statistical relationship between individual draft position and final regular season ranking. It's all just random.
Let's Try this Again
Alright, so what have we learned? We now know that when looking at individual relationships, there is not much to write home about. That, however, does not mean there is nothing to be gained from our data.
Correlations can be thrown off by all kinds of data quirks and offsetting trends. To best illustrate this, I present to you the most important graph of this analysis:
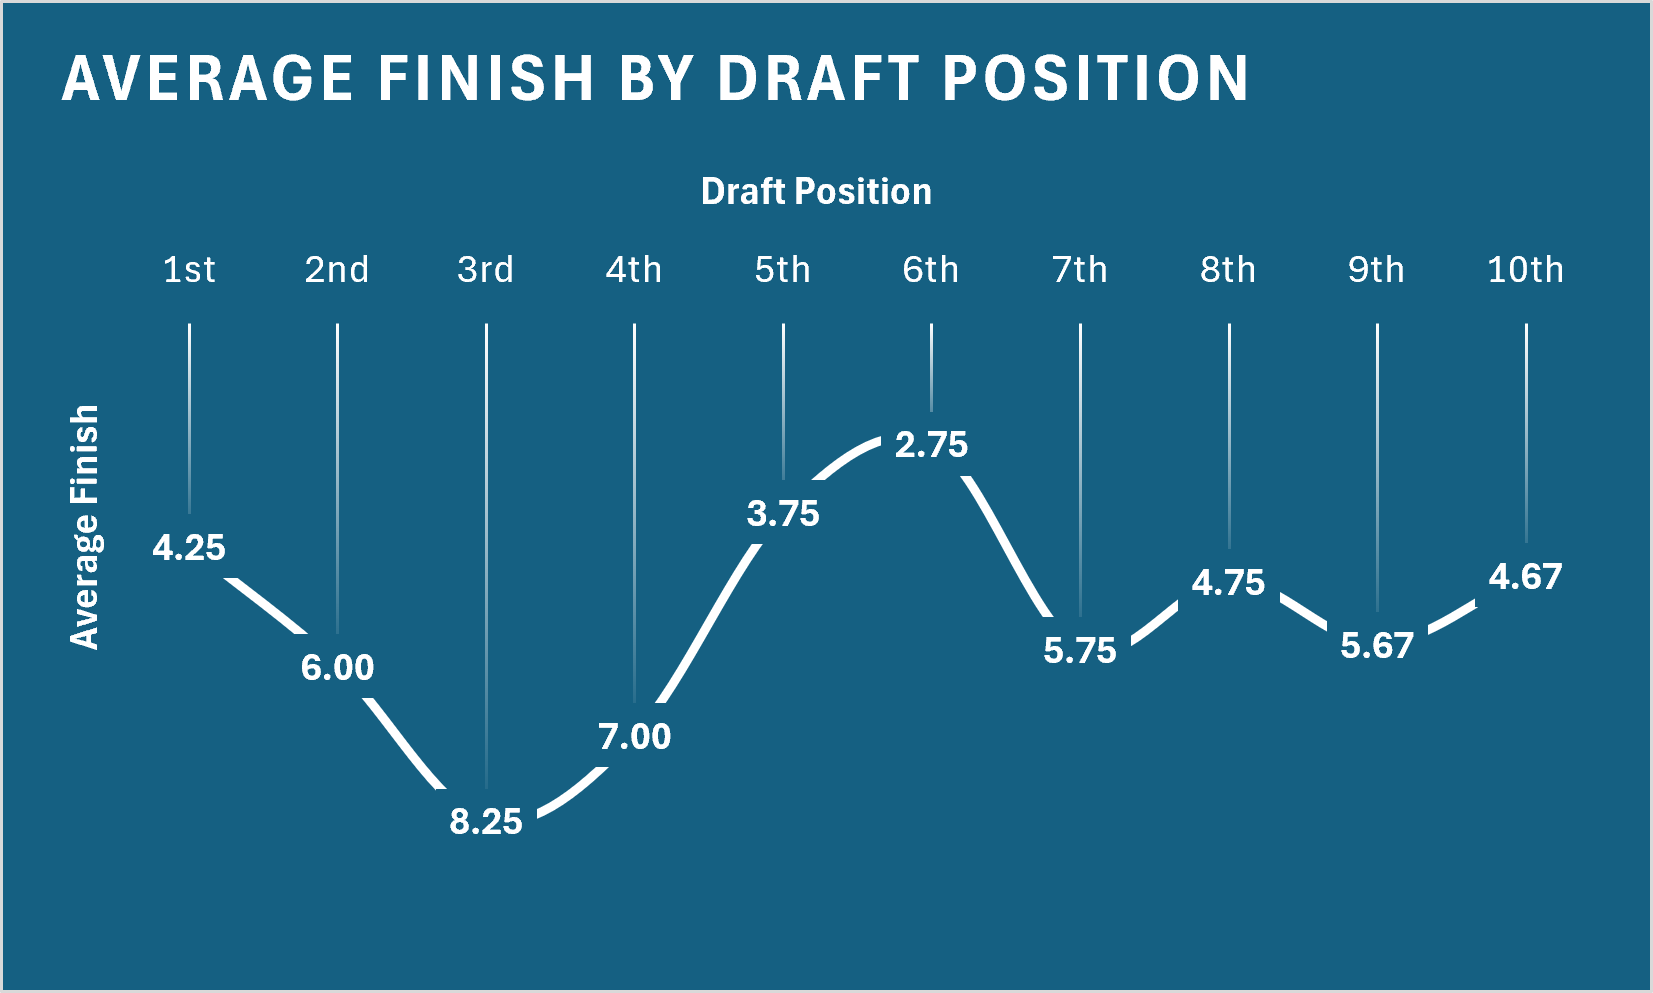
As we can see, there are large differences between individual draft positions, and we can even explain why our Spearman's P above was so weak. A correlation would be strong if there is consistent directional movements across the board, but from the graph we can see that performances swing back and forth.
We do notice that some draft positions fare far better than others, and at least one should be outright avoided.
For example, it appears that the best position to find yourself with is right smack in the middle at either 5th or 6th. Aside from the coveted 1.01, these two spots have produced finishes nearly a full ranking better than any other position. The 6th pick alone has produced 3 of our 4 regular-season champions.
Meanwhile, drafting 3rd or 4th almost guarantees that you’ll miss the playoffs. In fact, we have only had a manager finish in the top-4 once from either position since the league's inception.
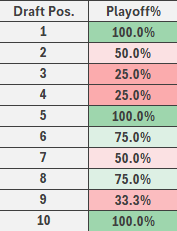
Speaking of the playoffs, I put together this nice little table showing the overall playoff clinch% from each draft position - just for you guys <3
First or Last?

Now I know we have dived quite deep here in our first "By the Numbers" analysis, but I apologize for nothing.
Given the graph above I had one last lingering question I just had to find an answer to. Is it better to be in the first half, or the last half, of the draft?
Well, in order to make Ricky Bobby proud, GSB ran one last analysis in an attempt to redeem Mr. Spearman.
We took a look at the average final ranking from the first half of the draft (picks #1-5) and the back half (picks #6-10). Turns out which group you land in matters quite a bit.
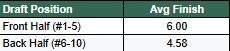
Now THIS is what we were looking for; something that I can finally latch on to and feel decently good about given I was this year's caboose! (I told you that negative correlation would come into play)
The best part?... It appears to be significant.
When revisiting our dear friend—the one-tailed homoscedastic t-test—we obtain a p-value of only 6.3%! That means that if there were no relationship, we would only get this large a difference about 1 out of 16 times.
Is that statistically significant? Well, technically, no.
But is it significant enough for me to cope? Absolutely.
As far as I'm concerned, being a back drafter is officially determined to be preferred over an earlier pick.
So, for now, I put down my calculator and close-without-saving my Excel sheet. My head will rest easy tonight and the dreams will be sweet. I hope you all got just as much from this as I did, and let's pray these numbers don't lie.



Reader conversation
Join the conversation
Share your take on this story. Comments publish immediately, and you can edit your own comment whenever you need to.
Sign in to add your perspective.
Data analysis for the win 🫡